Fusedash vs StatPecker
Side-by-side comparison to help you choose the right product.
Fusedash transforms raw data into interactive dashboards and charts, enabling instant insights for your team.
Last updated: March 4, 2026

StatPecker
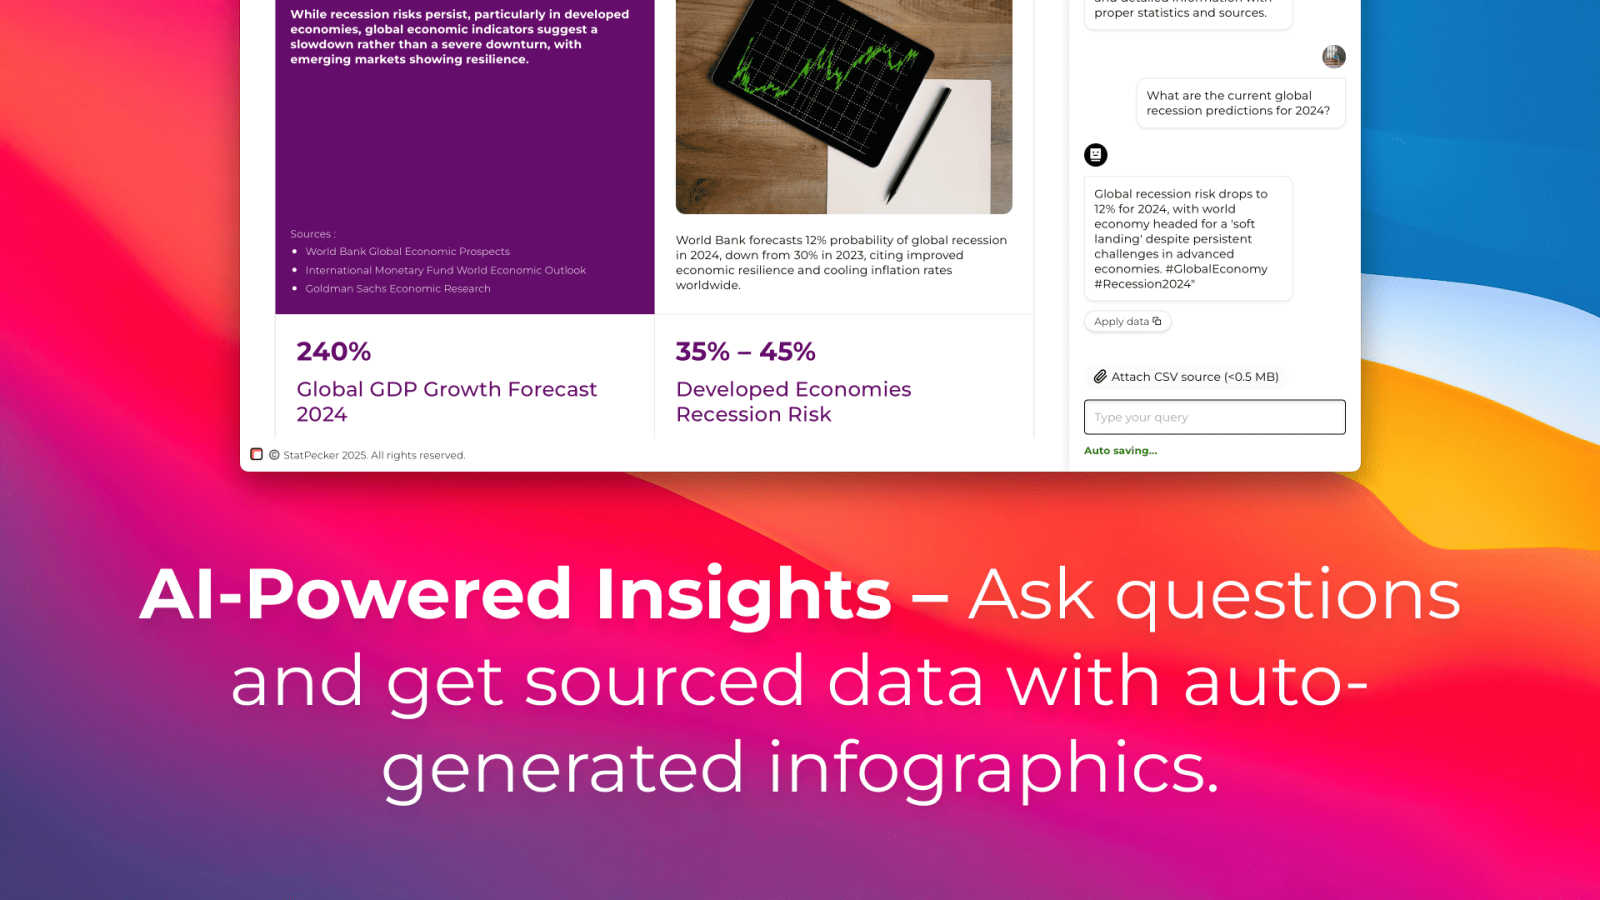
StatPecker transforms your data into rapid AI insights and stunning visuals for impactful storytelling and.
Last updated: March 1, 2026
Visual Comparison
Fusedash

StatPecker
Feature Comparison
Fusedash
Flexible Views
Fusedash offers the ability to build tailored dashboards, charts, maps, or report-style views, allowing different teams to access the specific answers they need. This feature minimizes unnecessary back and forth, enabling stakeholders to see what matters most while retaining a unified data source.
AI Chart Generator
The AI Chart Generator within Fusedash allows users to create powerful visuals from CSVs or APIs in mere minutes. Users can select the right chart type, apply comparisons, and refine labels to ensure the charts tell the right story, facilitating faster reporting and enhanced clarity.
Dashboard Software
Fusedash combines dashboarding and reporting in one workspace, allowing teams to monitor KPIs while giving context through narrative reporting. This feature helps clarify changes, their significance, and future implications, keeping teams aligned and reducing conflicting reports.
AI Chat
The Smart Chat feature allows users to interact with their data using plain language. This functionality accelerates the data exploration process, providing suggestions for metrics, charts, and breakdowns, and easily converting insights into shareable dashboard views.
StatPecker
Ask Your Query
With StatPecker, you can obtain instant insights from validated sources using AI. There's no need for complex tools; simply ask your questions and get immediate answers, making data exploration straightforward and efficient.
Publish & Embed
StatPecker allows you to create interactive visuals that can be seamlessly integrated into your blogs, articles, and websites. This feature ensures your data representations are not only informative but also engaging and shareable.
Upload & Analyze CSVs
Users can easily upload local CSV files (up to 50 MB) and gain insights without the typical spreadsheet hassle. The local SQL agent processes the data right on your device, ensuring privacy and quick access to visualized insights.
Instant Visuals
StatPecker generates clean, ready-to-share visualizations that can be used in a variety of contexts. Whether for reports, presentations, or social media, you can export infographics as images with ease, transforming your data into compelling visual narratives.
Use Cases
Fusedash
Marketing Performance Tracking
Marketing teams can utilize Fusedash to create dashboards that visualize campaign performance metrics, enabling them to quickly assess the success of various strategies. This helps in making data-driven decisions to optimize future campaigns based on real-time insights.
Sales Analytics
Sales teams can leverage Fusedash to monitor sales performance across different regions and segments. By using interactive charts and maps, they can identify trends, track targets, and allocate resources more effectively, enhancing overall sales strategies.
Financial Reporting
Finance departments can use Fusedash to generate comprehensive financial reports that combine various data sources. This allows them to present a clear financial picture to stakeholders, ensuring everyone understands key metrics and financial health.
Operational Efficiency Monitoring
Operations teams can employ Fusedash to track key operational metrics and workflows. By visualizing data through customizable dashboards, they can identify bottlenecks and inefficiencies, facilitating quicker adjustments and optimizations.
StatPecker
Data-Driven Marketing
Marketers can utilize StatPecker to visualize customer data and track campaign performance metrics. By creating infographics that depict trends and insights, they can make informed decisions that enhance marketing strategies and drive engagement.
Academic Research
Educators and researchers can leverage StatPecker to present complex data in visually appealing formats. This makes it easier for audiences to comprehend research findings and enhances the overall impact of academic presentations or publications.
Business Reporting
StatPecker is ideal for analysts who need to summarize and present business performance data. Its ability to generate quick, insightful visuals enables teams to share findings with stakeholders effectively, facilitating better strategic decisions.
Content Creation
Content creators can harness StatPecker's capabilities to enrich articles or blogs with informative infographics. By transforming raw data into eye-catching visuals, they can boost reader engagement and enhance the storytelling aspect of their content.
Overview
About Fusedash
Fusedash is a cutting-edge AI-powered data visualization platform crafted for teams eager to turn their connected data into clear, actionable insights. It serves as a unified workspace, enabling users to create decision-ready dashboards, interactive charts, detailed maps, and narrative reports without the hassle of reconstructing logic across multiple disconnected tools. The primary value proposition of Fusedash lies in its consistency and efficiency: key metrics and KPIs are defined once and reused across various views and reports, ensuring that everyone in the organization—from leadership to marketing to operations—aligns on the same trusted numbers. Fusedash is tailored for teams fed up with manual reporting cycles and conflicting data narratives. It empowers users to monitor real-time happenings while gaining a deeper understanding of the underlying reasons by drilling down into segments, regions, or time periods. With integrated AI features such as natural language data chat and intelligent visualization assistance, Fusedash accelerates data exploration and reporting, transforming raw data into a unified source of truth that fosters alignment and drives actionable insights.
About StatPecker
StatPecker is an innovative, AI-driven tool that transforms the data visualization landscape. It enables individuals and businesses to convert raw data into stunning infographics in just seconds. As data becomes the backbone of decision-making, StatPecker empowers content creators, analysts, marketers, educators, and researchers to present information engagingly and effectively. The tool eliminates the complexities often associated with traditional data visualization software, making it accessible to users of varying skill levels. By automating the data storytelling process, StatPecker facilitates effortless insight extraction, trend visualization, and the creation of impactful visual content. Whether you are crafting a detailed report, enhancing a presentation, or enriching an article, StatPecker equips you with essential tools to elevate your data presentation and engage your audience like never before.
Frequently Asked Questions
Fusedash FAQ
What types of data can I upload to Fusedash?
You can upload various data formats, including CSV files and connect through APIs. Fusedash also supports public data integration, allowing for enriched views that provide greater context.
How does Fusedash ensure data consistency across reports?
Fusedash allows you to define your key metrics and KPIs once, ensuring that they can be reused across all views and reports. This standardization helps maintain consistency and trust in the data presented throughout the organization.
Can I customize the dashboards for different teams?
Absolutely! Fusedash enables you to customize layouts, filters, and time ranges, ensuring that each team sees the data that matters most to them without duplicating work.
What are the AI capabilities of Fusedash?
Fusedash includes advanced AI features like Smart Chat, allowing users to ask questions in plain language and receive suggestions for metrics and visualizations. This functionality enhances data exploration and helps users find the insights they need quickly.
StatPecker FAQ
What types of data can I analyze with StatPecker?
You can analyze a variety of data types by uploading local CSV files. StatPecker enables you to extract insights and visualize data from these files efficiently.
Is my data safe when using StatPecker?
Yes, your data remains private while using StatPecker. The tool processes your uploaded CSV files directly on your device, ensuring that sensitive information is not shared or stored externally.
Can I integrate StatPecker visuals into my website?
Absolutely! StatPecker allows you to publish and embed your visuals seamlessly into blogs, articles, and websites, making it easy to share your findings with a wider audience.
What if I need help getting started with StatPecker?
StatPecker offers an intuitive interface, but if you encounter any issues, you can reach out for support. The team behind StatPecker is committed to helping users navigate the tool effectively and maximize its potential.
Alternatives
Fusedash Alternatives
Fusedash is an AI-powered data visualization platform designed to help teams turn their raw data into clear, actionable insights. As part of the analytics and business intelligence category, it provides a unified workspace for creating decision-ready dashboards and reports. Users commonly seek alternatives to Fusedash for various reasons, including pricing concerns, specific feature requirements, or compatibility with existing systems and workflows. When choosing an alternative, it's essential to consider factors such as ease of use, integration capabilities, and the ability to deliver consistent and reliable data across the organization.
StatPecker Alternatives
StatPecker is an innovative AI-driven tool designed for data visualization, empowering users to create engaging and informative visuals from raw data quickly and efficiently. As the demand for data-driven insights continues to grow, many users seek alternatives to StatPecker for various reasons, including pricing flexibility, specific feature sets, or compatibility with different platforms. Businesses and individuals may find that their unique needs require different capabilities that StatPecker may not fully address, prompting a search for other options. When considering alternatives, it's essential to evaluate the ease of use, the range of visualization features, and the ability to integrate with existing workflows. Look for tools that offer intuitive interfaces, robust data analysis capabilities, and customization options that align with your presentation goals. Additionally, consider pricing structures and support resources to ensure you choose a solution that meets your requirements.