Dividend Data vs Redbark
Side-by-side comparison to help you choose the right product.
Dividend Data
Get instant stock data and 30+ years of history directly in your Google Sheets or Excel.
Last updated: March 11, 2026
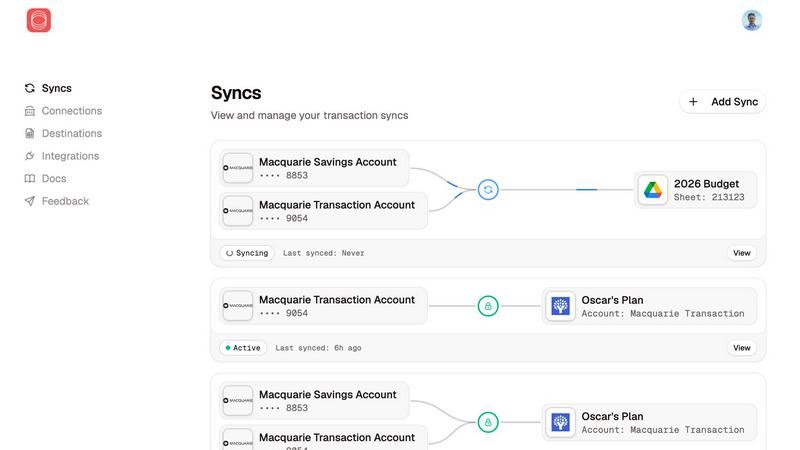
Redbark instantly syncs your Australian bank data to Google Sheets and YNAB automatically.
Last updated: March 4, 2026
Visual Comparison
Dividend Data

Redbark
Feature Comparison
Dividend Data
Instant Spreadsheet Integration
Access a vast financial database directly in your cells with 16+ custom functions. Simply type intuitive formulas like =DIVIDENDDATA_QUOTE("AAPL", "price") or =DIVIDENDDATA_RATIOS("KO", "PeRatio") to pull live, updated data instantly. It works natively in both Google Sheets and Microsoft Excel, turning your spreadsheet into a powerful, automated analysis terminal without any coding or complex setup.
Comprehensive Dividend & Fundamental Data
Get everything a serious investor needs in one place. The platform provides deep data sets including forward and historical dividends, ex-dates, yields, payout ratios, and dividend growth rates. Beyond dividends, access full financial statements (income, balance sheet, cash flow), earnings metrics, valuation ratios, and price history—over 100 key metrics derived from 30+ years of historical market data.
Built for Speed and Efficiency
Experience average response times under 0.84 seconds. This tool is engineered for speed, delivering data almost instantly as you build or update your models. This eliminates waiting for web queries or manual updates, allowing you to screen stocks, update portfolios, and perform analysis with unprecedented speed and efficiency, keeping your decisions based on the latest information.
Robust Free Tier with No Expiration
Start analyzing immediately with a genuinely free plan that provides 2,500 credits every month, forever. There's no trial period that cuts off, and no credit card is required to begin. This allows individual investors to perform substantial research and build automated spreadsheets at zero cost, lowering the barrier to professional-grade investment tools.
Redbark
Pass-Through Data Architecture
Your financial data flows directly from your bank to your destination tool at high speed. Redbark never stores your transactions, balances, or account details on its servers. This ensures maximum privacy and security, with data moving in a seamless, efficient pipeline from source to spreadsheet without unnecessary stops.
100+ Bank & Brokerage Integrations
Connect to every major Australian bank and credit union via the regulated CDR system, along with global brokerages and crypto exchanges. This extensive coverage means you can aggregate virtually all your financial accounts in one place quickly, from everyday banking to complex investment portfolios, without compatibility headaches.
Automated Background Sync & Smart Deduplication
Forget manual refreshes. Your bank pushes new data via instant webhooks, triggering automatic background syncs so your sheets are always current. Intelligent ID-based deduplication with overlap buffers catches late-posting transactions, ensuring you never have duplicate rows cluttering your data.
Multi-Destination & Multi-Account Support
Sync the same bank accounts to multiple tools simultaneously—like Google Sheets, YNAB, and Actual Budget—each with its own custom formatting. You can also sync every account separately—savings, transactions, credit cards, loans—each to its own dedicated sheet, budget, or database for ultimate organizational speed.
Use Cases
Dividend Data
Automated Dividend Portfolio Tracking
Eliminate manual monthly updates. Create a master portfolio sheet that automatically updates dividend amounts, payment dates, yields, and declared amounts for all your holdings. Instantly calculate projected annual income, track dividend growth, and monitor ex-dividend dates without ever leaving your spreadsheet, saving hours of manual data entry.
Rapid Stock Screening and Analysis
Screen thousands of stocks in minutes based on your custom criteria. Use formulas to pull PE ratios, dividend yields, payout ratios, or debt-to-equity across entire watchlists. Quickly compare fundamentals side-by-side to identify undervalued dividend growers or filter out overpriced stocks, accelerating your due diligence process dramatically.
Building Dynamic Financial Models
Construct powerful, auto-updating discounted cash flow (DCF) models or dividend discount models (DDM). Pull in historical EPS, growth rates, and balance sheet data directly into your assumptions. Your model stays current with live price and financial data, ensuring your valuation outputs are always based on the latest available market information.
Historical Performance Backtesting
Test investment strategies against decades of market data. Pull 30+ years of historical prices, dividend payments, and financial ratios to backtest how a dividend growth or value strategy would have performed. Analyze trends, calculate compound annual growth rates, and validate your thesis with robust, long-term historical datasets.
Redbark
Real-Time Business Cash Flow Management
Small business owners and freelancers can automate their bookkeeping by having all business account transactions sync instantly to a Google Sheet. This provides a live, always-updated view of income, expenses, and cash flow, enabling faster decision-making and streamlined invoice tracking without manual entry.
Automated Investment Portfolio Tracking
Investors can connect global brokerage accounts to automatically sync holdings and transaction data into a central dashboard. This allows for rapid, automated performance monitoring across different asset classes and platforms, saving hours of manual logging and providing a consolidated, real-time financial picture.
Effortless Personal Budgeting
Individuals can connect their everyday accounts and credit cards to sync transactions directly into budgeting apps like YNAB or Actual Budget. This eliminates the slow, frustrating chore of manual transaction entry, ensuring budgets are always accurate and up-to-date with the latest spending, all happening automatically in the background.
Consolidated Financial Reporting
Financial analysts, advisors, or individuals managing complex finances can aggregate data from multiple banks, loans, and investment accounts into a single Notion database or Google Sheet. This creates a powerful, automated reporting hub for net worth tracking, audit trails, and financial analysis with data that refreshes at lightning speed.
Overview
About Dividend Data
Dividend Data is the lightning-fast gateway to institutional-grade stock market intelligence, built directly into the spreadsheets you already use. It eliminates the tedious, error-prone manual work of copying, pasting, and updating stock data. Designed specifically for dividend and fundamental investors, the tool provides instant, live access to over 30 years of historical data for more than 80,000 global tickers. You get dividends, yields, payout ratios, growth rates, complete financial statements, key ratios, price history, and over 100 essential metrics through simple, custom formulas. Just type a formula like =DIVIDENDDATA_DIVIDENDS("MSFT") and the data populates your cell in under a second. No API keys to manage, no coding required, and no more broken links. Its robust free tier offers 2,500 monthly credits with no trial expiration, making professional analysis accessible to everyone. Built by a dividend investor for dividend investors, it delivers the depth and reliability of expensive terminals without the prohibitive cost, supercharging your research and portfolio tracking directly within Google Sheets and Microsoft Excel.
About Redbark
Redbark is the lightning-fast, secure bridge for your financial data. It connects your Australian bank accounts and global investment portfolios directly to the productivity tools you already use, like Google Sheets, Notion, YNAB, and Airtable. This eliminates the tedious, error-prone chore of manual data entry and messy CSV file imports forever. Instead of relying on outdated and risky screen-scraping methods, Redbark leverages Australia's official Consumer Data Right (CDR) framework, giving you bank-approved, secure access to your transaction, balance, and investment data. Your information syncs automatically on a schedule you control, flowing directly from your financial institution to your chosen destination without ever being stored on Redbark's servers. Built with speed, simplicity, and ironclad privacy at its core, it's the perfect automated solution for freelancers tracking invoices, investors monitoring portfolios, small business owners managing cash flow, and anyone who wants a clear, real-time view of their finances in a familiar spreadsheet or dashboard. Setup takes just minutes with no coding required, supporting a wide range of Australian banks via CDR, New Zealand banks, and global brokerages.
Frequently Asked Questions
Dividend Data FAQ
How does the free tier work?
The free tier provides 2,500 credits every rolling month at no cost and requires no credit card to sign up. Each data point retrieved by a formula (e.g., one cell with a price or a dividend yield) typically costs one credit. This plan does not expire, allowing you to perform significant analysis continuously. You can monitor your usage directly within the add-in.
What data sources does Dividend Data use?
Dividend Data aggregates and cleans data from multiple high-quality, institutional-grade financial data providers to ensure accuracy and comprehensiveness. This includes exchange data, regulatory filings (like 10-Ks and 10-Qs), and other trusted financial databases, providing you with reliable and audit-ready data for over 80,000 global securities.
Do I need to know how to code or use APIs?
Absolutely not. Dividend Data is designed for investors, not programmers. There is no API key to configure. You simply install the add-in for Google Sheets or Microsoft Excel and start using the plain-English custom formulas directly in your spreadsheet cells. The data flows in automatically with zero technical setup.
Is my data and portfolio information secure?
Yes. Your spreadsheet data and portfolio lists remain private in your own Google or Microsoft Excel file. Dividend Data's formulas only send the ticker symbol and metric you request to its servers to fetch the corresponding public market data. Your personal holdings, share counts, and proprietary models are never transmitted or stored on Dividend Data's servers.
Redbark FAQ
How is Redbark different from screen scraping?
Redbark does not use insecure screen scraping. It connects to Australian banks via the official Consumer Data Right (CDR) framework through an ACCC-accredited intermediary. This is a regulated, bank-approved method that is faster, more reliable, and far more secure, with transparent user consent and data handling practices.
Is my financial data stored on Redbark's servers?
No. Redbark uses a pass-through data architecture. Your transaction and balance data flows directly from your bank to your chosen destination (like Google Sheets) without being stored on Redbark's systems. We only store encrypted connection tokens necessary for the sync process, never your actual financial data.
Which Australian banks and destinations do you support?
We support all major Australian banks and many credit unions via CDR Open Banking, including CommBank, Westpac, NAB, ANZ, and Macquarie. You can sync data to Google Sheets, Notion, YNAB, Actual Budget, and more. A full, updated list of connections and destinations is available on our website.
How does the automated sync work?
Once connected, Redbark can sync data on a schedule you set. For many CDR-connected banks, we also use webhooks—instant notifications from your bank when a new transaction occurs. This triggers an immediate background sync, pushing the new data to your tools in near real-time, often within minutes of the transaction.
Alternatives
Dividend Data Alternatives
Dividend Data is a specialized financial data add-on that delivers decades of stock market information directly into spreadsheets. It falls into the category of tools for fundamental and dividend investors who need fast, reliable data without complex setups. Users often explore alternatives for various reasons. Some need a different pricing structure, require specific data points not covered, or must integrate with platforms other than Excel or Google Sheets. Others might seek a different user experience or have unique workflow demands. When evaluating other options, key considerations include the depth and accuracy of historical data, the simplicity of the integration into your existing spreadsheets, the transparency of the pricing model, and whether the tool's features align with a dividend-focused investment strategy. The goal is to find a solution that removes friction from your research process.
Redbark Alternatives
Redbark is a secure data connector that automatically syncs financial data from Australian banks and global brokerages to apps like Google Sheets. It operates in the personal and business finance automation category, eliminating manual data entry through direct, bank-approved connections. Users often seek alternatives for various reasons. These can include budget constraints, a need for different integration platforms, or specific feature requirements not covered by a single tool. It's a common step to find the perfect fit for one's unique financial workflow. When evaluating options, prioritize security, reliability, and ease of use. Look for tools that offer direct, official data access methods over less secure workarounds. Ensure the platform supports your specific banks and connects to the apps where you need your data to live.