Dividend Data vs GrowPanel
Side-by-side comparison to help you choose the right product.
Dividend Data
Get instant stock data and 30+ years of history directly in your Google Sheets or Excel.
Last updated: March 11, 2026
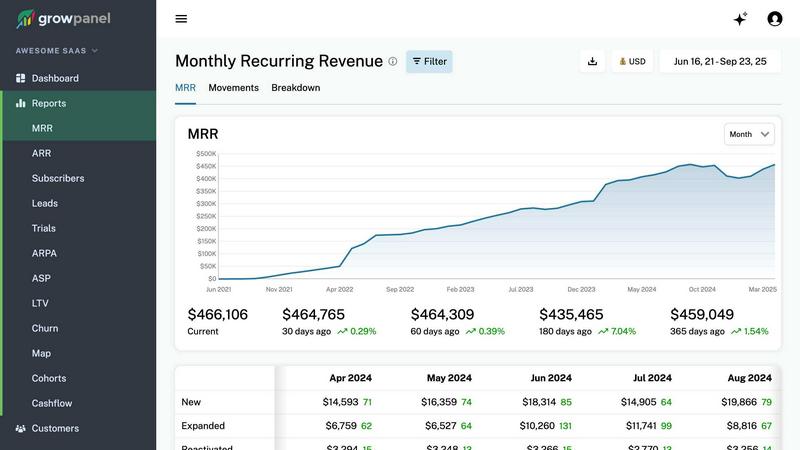
GrowPanel
GrowPanel delivers real-time MRR, churn, and LTV analytics for SaaS, connecting billing platforms effortlessly.
Last updated: February 27, 2026
Visual Comparison
Dividend Data

GrowPanel
Feature Comparison
Dividend Data
Instant Spreadsheet Integration
Access a vast financial database directly in your cells with 16+ custom functions. Simply type intuitive formulas like =DIVIDENDDATA_QUOTE("AAPL", "price") or =DIVIDENDDATA_RATIOS("KO", "PeRatio") to pull live, updated data instantly. It works natively in both Google Sheets and Microsoft Excel, turning your spreadsheet into a powerful, automated analysis terminal without any coding or complex setup.
Comprehensive Dividend & Fundamental Data
Get everything a serious investor needs in one place. The platform provides deep data sets including forward and historical dividends, ex-dates, yields, payout ratios, and dividend growth rates. Beyond dividends, access full financial statements (income, balance sheet, cash flow), earnings metrics, valuation ratios, and price history—over 100 key metrics derived from 30+ years of historical market data.
Built for Speed and Efficiency
Experience average response times under 0.84 seconds. This tool is engineered for speed, delivering data almost instantly as you build or update your models. This eliminates waiting for web queries or manual updates, allowing you to screen stocks, update portfolios, and perform analysis with unprecedented speed and efficiency, keeping your decisions based on the latest information.
Robust Free Tier with No Expiration
Start analyzing immediately with a genuinely free plan that provides 2,500 credits every month, forever. There's no trial period that cuts off, and no credit card is required to begin. This allows individual investors to perform substantial research and build automated spreadsheets at zero cost, lowering the barrier to professional-grade investment tools.
GrowPanel
Real-Time Revenue Tracking
GrowPanel offers real-time tracking of your MRR, ARR, churn, and customer lifetime value (LTV). This feature allows businesses to monitor their revenue metrics instantly, providing clarity on financial performance and enabling swift decision-making.
Cohort and Trial Analysis
With in-depth cohort and trial analysis capabilities, GrowPanel helps businesses understand user behavior and conversion patterns. This feature allows you to visualize retention rates over time, spot trends, and convert more trials into paying customers, thus maximizing revenue potential.
Cashflow Reporting
The cashflow reporting feature offers comprehensive insights into all revenue streams, including recurring payments, refunds, taxes, and fees. This ensures that businesses have a clear understanding of their financial health and can manage cash flows effectively.
AI-Powered Insights
GrowPanel’s AI chat capability allows users to interact with their data using plain language. You can ask questions about key metrics and receive instant, clear answers, facilitating a deeper understanding of your business performance without navigating complex dashboards.
Use Cases
Dividend Data
Automated Dividend Portfolio Tracking
Eliminate manual monthly updates. Create a master portfolio sheet that automatically updates dividend amounts, payment dates, yields, and declared amounts for all your holdings. Instantly calculate projected annual income, track dividend growth, and monitor ex-dividend dates without ever leaving your spreadsheet, saving hours of manual data entry.
Rapid Stock Screening and Analysis
Screen thousands of stocks in minutes based on your custom criteria. Use formulas to pull PE ratios, dividend yields, payout ratios, or debt-to-equity across entire watchlists. Quickly compare fundamentals side-by-side to identify undervalued dividend growers or filter out overpriced stocks, accelerating your due diligence process dramatically.
Building Dynamic Financial Models
Construct powerful, auto-updating discounted cash flow (DCF) models or dividend discount models (DDM). Pull in historical EPS, growth rates, and balance sheet data directly into your assumptions. Your model stays current with live price and financial data, ensuring your valuation outputs are always based on the latest available market information.
Historical Performance Backtesting
Test investment strategies against decades of market data. Pull 30+ years of historical prices, dividend payments, and financial ratios to backtest how a dividend growth or value strategy would have performed. Analyze trends, calculate compound annual growth rates, and validate your thesis with robust, long-term historical datasets.
GrowPanel
Revenue Optimization
SaaS companies can utilize GrowPanel to optimize their revenue streams by analyzing MRR, ARR, and churn rates. By understanding these metrics in real time, businesses can implement targeted strategies that drive growth and reduce churn.
Customer Behavior Analysis
GrowPanel enables businesses to dive deep into customer behavior through cohort analysis. By understanding how different segments interact with your product, you can tailor marketing strategies to improve conversion rates and customer satisfaction.
Cashflow Management
Companies can leverage GrowPanel's robust cashflow reporting to oversee their financial operations. By monitoring refunds, taxes, and fees, businesses can make informed decisions that enhance financial stability and predict future cash positions.
Performance Monitoring
GrowPanel’s mobile-friendly dashboards allow SaaS founders and teams to monitor all key metrics on the go. This real-time access ensures that stakeholders can stay informed about business performance, making it easier to act swiftly on emerging trends.
Overview
About Dividend Data
Dividend Data is the lightning-fast gateway to institutional-grade stock market intelligence, built directly into the spreadsheets you already use. It eliminates the tedious, error-prone manual work of copying, pasting, and updating stock data. Designed specifically for dividend and fundamental investors, the tool provides instant, live access to over 30 years of historical data for more than 80,000 global tickers. You get dividends, yields, payout ratios, growth rates, complete financial statements, key ratios, price history, and over 100 essential metrics through simple, custom formulas. Just type a formula like =DIVIDENDDATA_DIVIDENDS("MSFT") and the data populates your cell in under a second. No API keys to manage, no coding required, and no more broken links. Its robust free tier offers 2,500 monthly credits with no trial expiration, making professional analysis accessible to everyone. Built by a dividend investor for dividend investors, it delivers the depth and reliability of expensive terminals without the prohibitive cost, supercharging your research and portfolio tracking directly within Google Sheets and Microsoft Excel.
About GrowPanel
GrowPanel is an innovative subscription analytics platform designed specifically for SaaS companies seeking clarity in their revenue metrics. It eliminates the chaos of spreadsheets by providing a seamless, one-click integration with popular billing platforms like Stripe, Chargebee, and Recurly. Once connected, users can access instant, real-time dashboards that visualize critical metrics such as Monthly Recurring Revenue (MRR), Annual Recurring Revenue (ARR), churn rates, retention rates, expansion revenue, and cohort analysis. This platform is perfect for startups and established businesses alike, enabling them to make informed decisions based on accurate data. With a user-friendly interface and a focus on automation, GrowPanel empowers companies to optimize their revenue strategies and enhance customer retention. Best of all, you can use GrowPanel for free until your business reaches $200k ARR, making it an ideal choice for high-growth SaaS businesses looking to scale without hefty upfront costs.
Frequently Asked Questions
Dividend Data FAQ
How does the free tier work?
The free tier provides 2,500 credits every rolling month at no cost and requires no credit card to sign up. Each data point retrieved by a formula (e.g., one cell with a price or a dividend yield) typically costs one credit. This plan does not expire, allowing you to perform significant analysis continuously. You can monitor your usage directly within the add-in.
What data sources does Dividend Data use?
Dividend Data aggregates and cleans data from multiple high-quality, institutional-grade financial data providers to ensure accuracy and comprehensiveness. This includes exchange data, regulatory filings (like 10-Ks and 10-Qs), and other trusted financial databases, providing you with reliable and audit-ready data for over 80,000 global securities.
Do I need to know how to code or use APIs?
Absolutely not. Dividend Data is designed for investors, not programmers. There is no API key to configure. You simply install the add-in for Google Sheets or Microsoft Excel and start using the plain-English custom formulas directly in your spreadsheet cells. The data flows in automatically with zero technical setup.
Is my data and portfolio information secure?
Yes. Your spreadsheet data and portfolio lists remain private in your own Google or Microsoft Excel file. Dividend Data's formulas only send the ticker symbol and metric you request to its servers to fetch the corresponding public market data. Your personal holdings, share counts, and proprietary models are never transmitted or stored on Dividend Data's servers.
GrowPanel FAQ
What types of billing platforms can I connect with GrowPanel?
GrowPanel seamlessly integrates with popular billing platforms such as Stripe, Chargebee, Recurly, and others, allowing for easy data synchronization and analysis.
Is GrowPanel GDPR compliant?
Yes, GrowPanel is EU-hosted and fully compliant with GDPR regulations, ensuring your data is handled securely and in accordance with European privacy laws.
How does the AI chat feature work?
The AI chat feature allows users to query their metrics in plain language. Simply ask questions like "What is our churn rate?" and receive immediate, understandable answers without wading through complex reports.
What happens when I reach $200k ARR?
Once your business reaches $200k ARR, you will need to choose a paid plan to continue using GrowPanel. Until then, you can enjoy all the features for free, making it a valuable tool for growing SaaS businesses.
Alternatives
Dividend Data Alternatives
Dividend Data is a specialized financial data add-on that delivers decades of stock market information directly into spreadsheets. It falls into the category of tools for fundamental and dividend investors who need fast, reliable data without complex setups. Users often explore alternatives for various reasons. Some need a different pricing structure, require specific data points not covered, or must integrate with platforms other than Excel or Google Sheets. Others might seek a different user experience or have unique workflow demands. When evaluating other options, key considerations include the depth and accuracy of historical data, the simplicity of the integration into your existing spreadsheets, the transparency of the pricing model, and whether the tool's features align with a dividend-focused investment strategy. The goal is to find a solution that removes friction from your research process.
GrowPanel Alternatives
GrowPanel is a cutting-edge subscription analytics platform tailored for SaaS companies seeking clarity in their revenue metrics. It falls under the analytics and data category, enabling businesses to connect their billing platforms effortlessly and gain real-time insights into MRR, ARR, churn, and more. Users often search for alternatives due to factors like pricing structures, specific feature sets, or unique platform needs that may not align with their operational requirements. When selecting an alternative, consider aspects such as ease of integration, the comprehensiveness of analytics, user-friendliness, and customer support to ensure it meets your business objectives.