skills.ai

About skills.ai
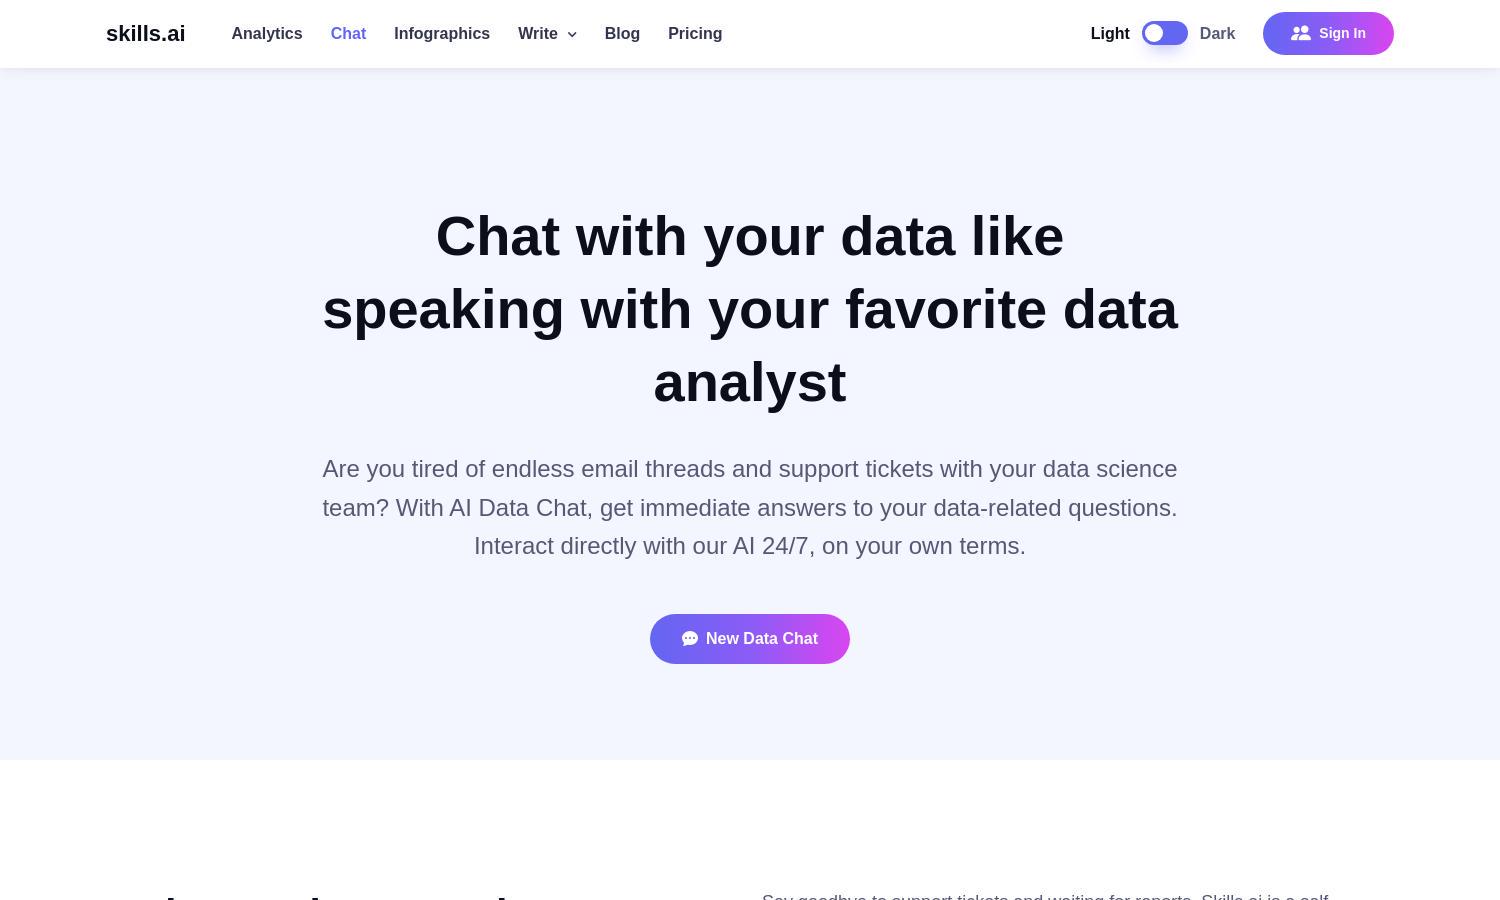
Skills.ai is an innovative analytics platform that empowers data professionals to interact with their data seamlessly. Users can ask questions in natural language and receive instant answers, making data analysis more efficient. It revolutionizes how teams handle queries and obtain insights using AI technology.
Skills.ai offers flexible pricing plans catering to varying user needs, including free trials for new users and paid tiers with enhanced features. Upgrading not only provides more advanced capabilities but also dedicated support for complex analytics tasks, ensuring optimal user experience and value.
The user interface of Skills.ai is designed for simplicity and efficiency, allowing effortless navigation through analytics tasks. With a clean layout and intuitive features, users can easily upload data, ask questions, and generate visualizations, creating a seamless and enjoyable browsing experience.
How skills.ai works
Users start by integrating their data source to Skills.ai, where they can upload files or connect via Google Sheets. Once onboarded, users can ask analytics questions in natural language, with the AI instantly generating answers, charts, and code for further analysis, all while maintaining user control over outputs.
Key Features for skills.ai
Natural Language Data Querying
Skills.ai features natural language querying, allowing users to effortlessly interact with their data. This innovative capability empowers users to ask complex analytics questions in plain English and receive immediate, actionable responses, simplifying the data analysis process.
Real-Time Data Visualization
With real-time data visualization, Skills.ai enables users to generate insightful charts and graphs on demand. This feature significantly enhances the analytics process, making it easy for data teams to present findings visually and improve their decision-making capabilities.
User-Driven Customization Options
Skills.ai includes user-driven customization options, where users can tweak color schemes and modify charts to suit their preferences. This ensures that the visualizations align with users' branding and analytical needs, providing a tailored experience for enhanced presentation quality.


